Service graphs
|
|
|
|
Graph Information
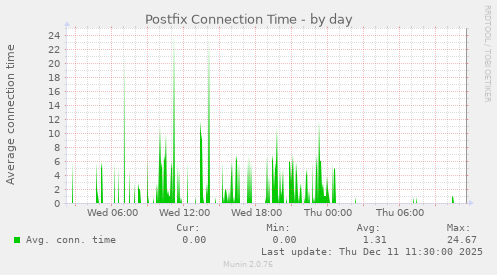
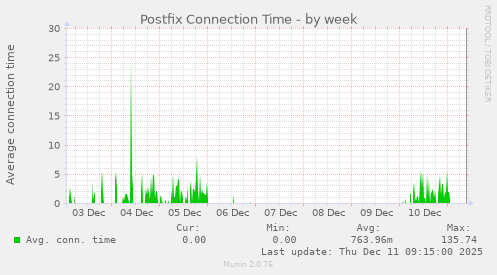
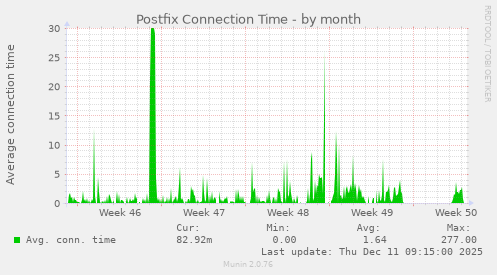
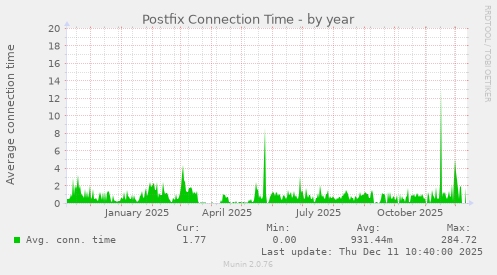
This graph shows the average time that clients are connected to postfix. Increases may be due to large messages, system load, slow clients etc.
| Field | Internal name | Type | Warn | Crit | Info |
|---|---|---|---|---|---|
| Avg. conn. time | conntime | gauge |