Service graphs
Graph Information
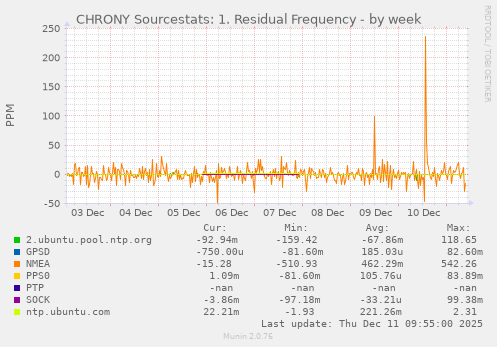
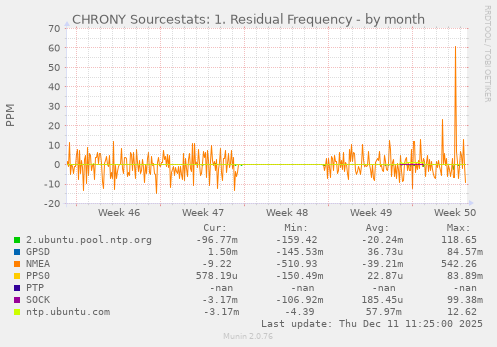
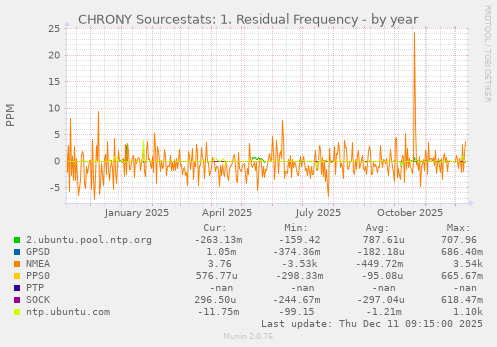
This shows the residual frequency
for the currently selected reference source. This reflects any difference between what the measurements from the reference source indicate the frequency should be and the frequency currently being used. The reason this is not always zero is that a smoothing procedure is applied to the frequency. Each time a measurement from the reference source is obtained and a new residual frequency computed, the estimated accuracy of this residual is compared with the estimated accuracy (see skew) of the existing frequency value. A weighted average is computed for the new frequency, with weights depending on these accuracies. If the measurements from the reference source follow a consistent trend, the residual will be driven to zero over time.
| Field |
Internal name |
Type |
Warn |
Crit |
Info |
| 2.ubuntu.pool.ntp.org |
_ubuntu_pool_ntp_org_freq |
gauge |
|
|
|
| GPSD |
GPSD_freq |
gauge |
|
|
|
| NMEA |
NMEA_freq |
gauge |
|
|
|
| PPS0 |
PPS0_freq |
gauge |
|
|
|
| PTP |
PTP_freq |
gauge |
|
|
|
| SOCK |
SOCK_freq |
gauge |
|
|
|
| ntp.ubuntu.com |
ntp_ubuntu_com_freq |
gauge |
|
|
|